Baseball Operations, Research & Development Independent Project · 2026
MLB Pitcher Outing Reports: R Shiny App
What did this pitcher actually do, outing by outing?
Status: This app runs locally in RStudio. The full walkthrough with screenshots is below.
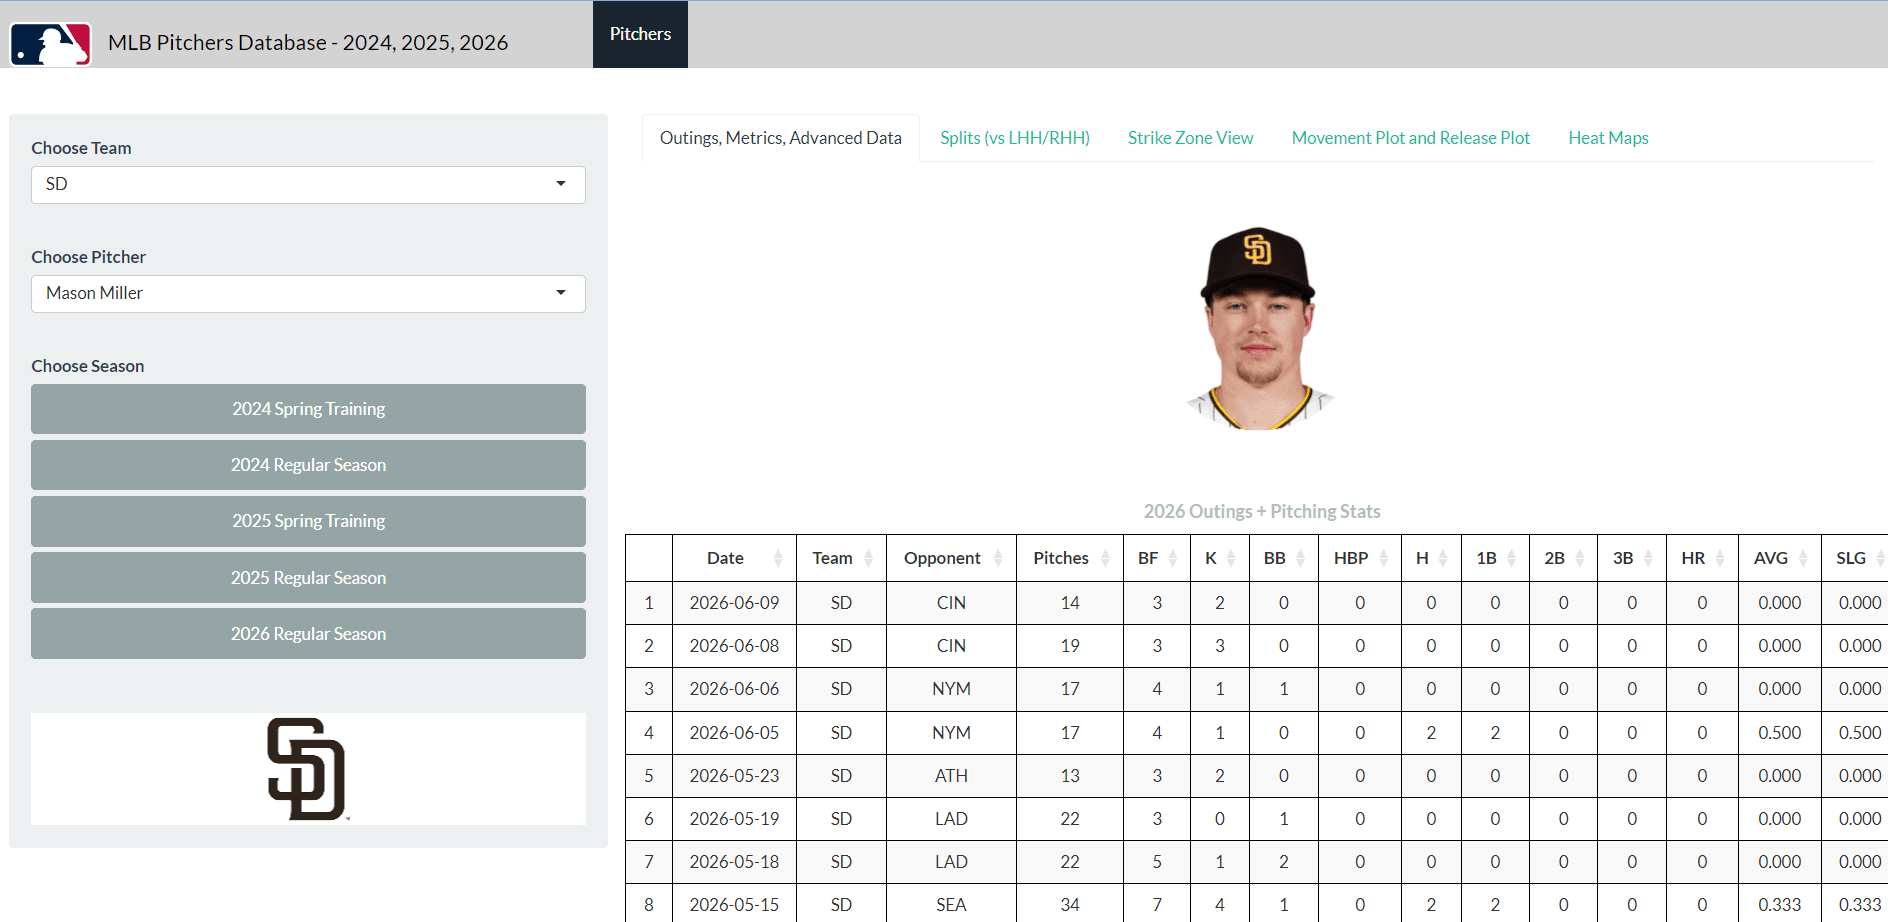
This is an R Shiny app I built to break down MLB pitchers outing by outing. Pick a team and a pitcher, and the entire app filters to what you selected: season-level views for the big picture, or click into a single outing and every tab updates to just that appearance. The examples below use Mason Miller.
Home Page and Outing Selection
When you first run the app, the sidebar gives you two dropdown menus to select a team and a pitcher, with buttons to filter by season. The team logo pulls in through the mlbplotR package, and once you select a pitcher his headshot appears alongside it. Below that you get his current season outings for whatever season you selected. Click an outing and it highlights blue, and the entire app filters to just that outing.
Outings, Metrics, and Advanced Data
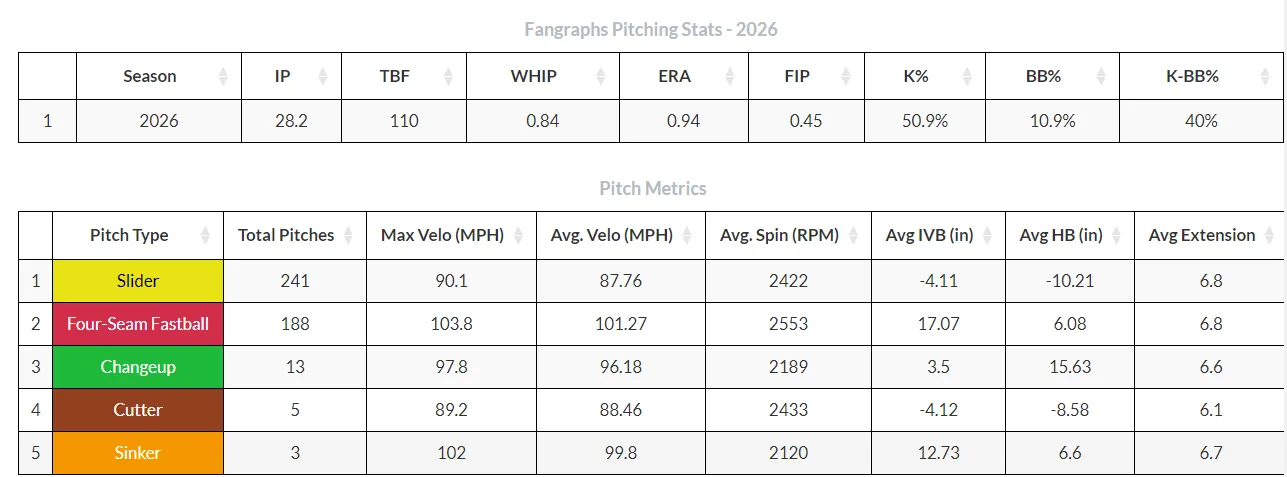
Below the outings are two data tables. The first pulls directly from FanGraphs using baseballr. Under that is the Pitch Metrics table, which shows how many of each pitch type he has thrown along with the metrics behind them.
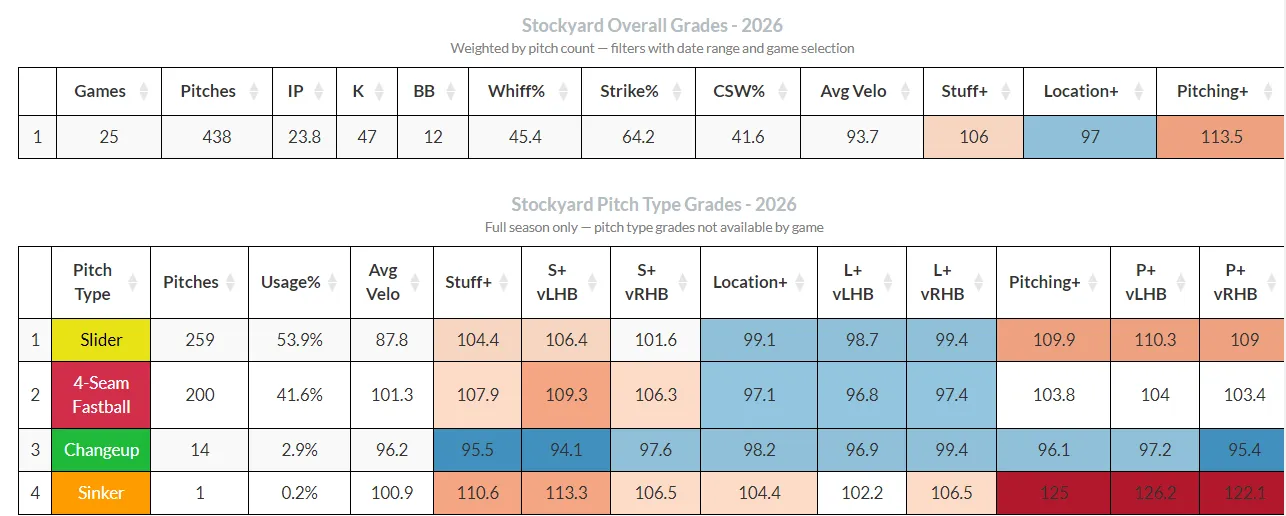
Next is an integration I built with Robert Stock’s Stockyard Baseball site for his pitch grading model, bringing Stuff+, Location+, and Pitching+ style grades into the app. Some numbers can differ slightly because his pitch data pipeline is not identical to mine. I actively work with him to compare what I’m pulling against what he’s building, making sure my counts are accurate and I’m not missing chunks of a pitch type. His system also includes pitch tagging correctors, while mine stays true to what Statcast’s APIs have tagged.
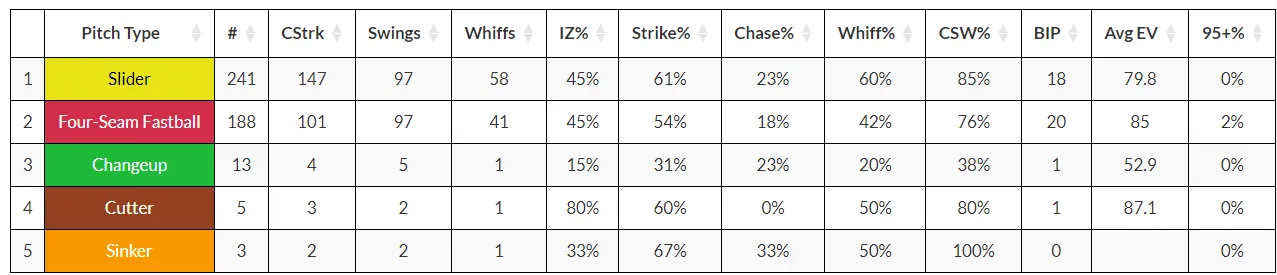
The Advanced Insights table digs a level deeper: in-zone rates, chase%, whiff%, and the other plate discipline numbers I want when the surface stats need context.
Splits vs. LHH and RHH
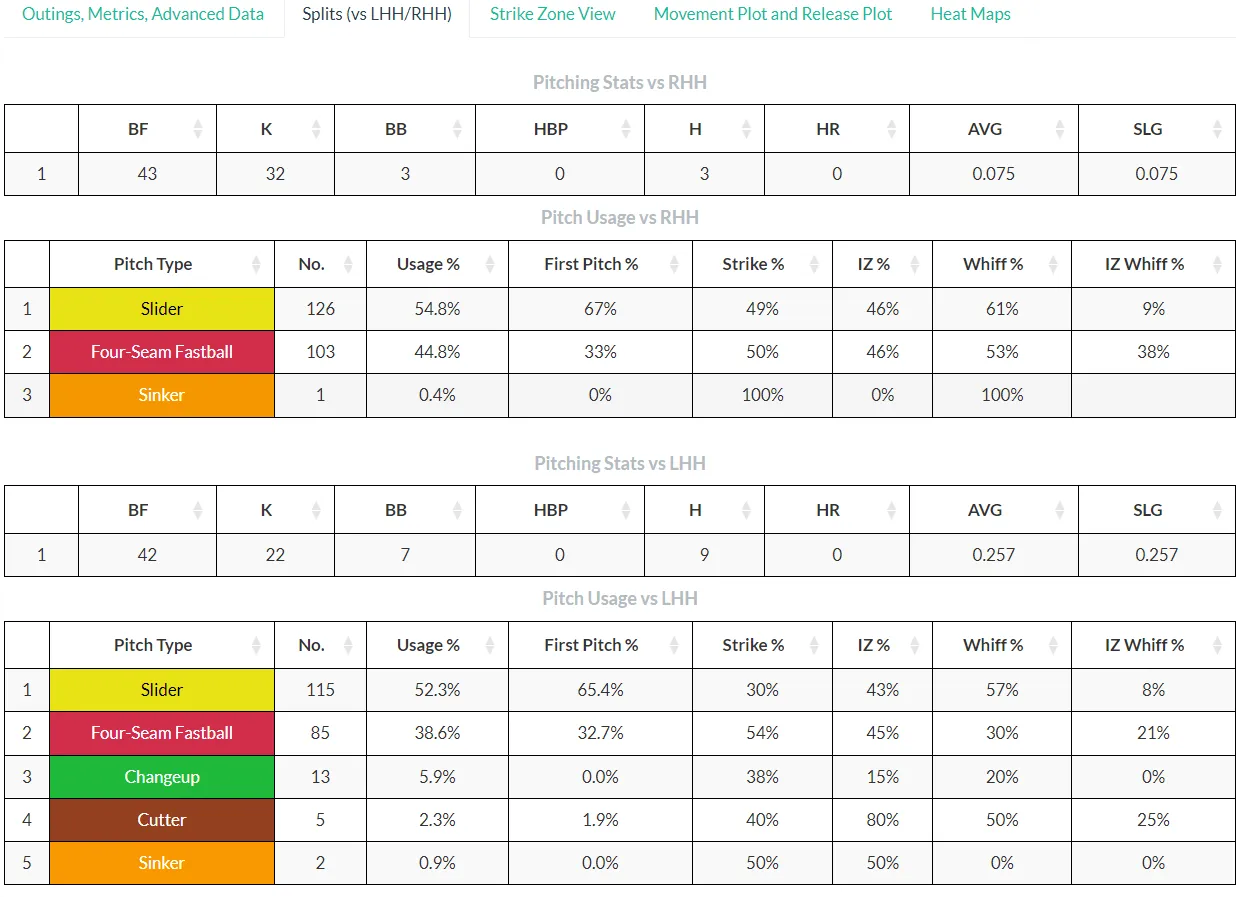
The Splits tab pulls pitch data by batter handedness to see how a pitcher attacks both sides, and how his arsenal may differ against righties versus lefties.
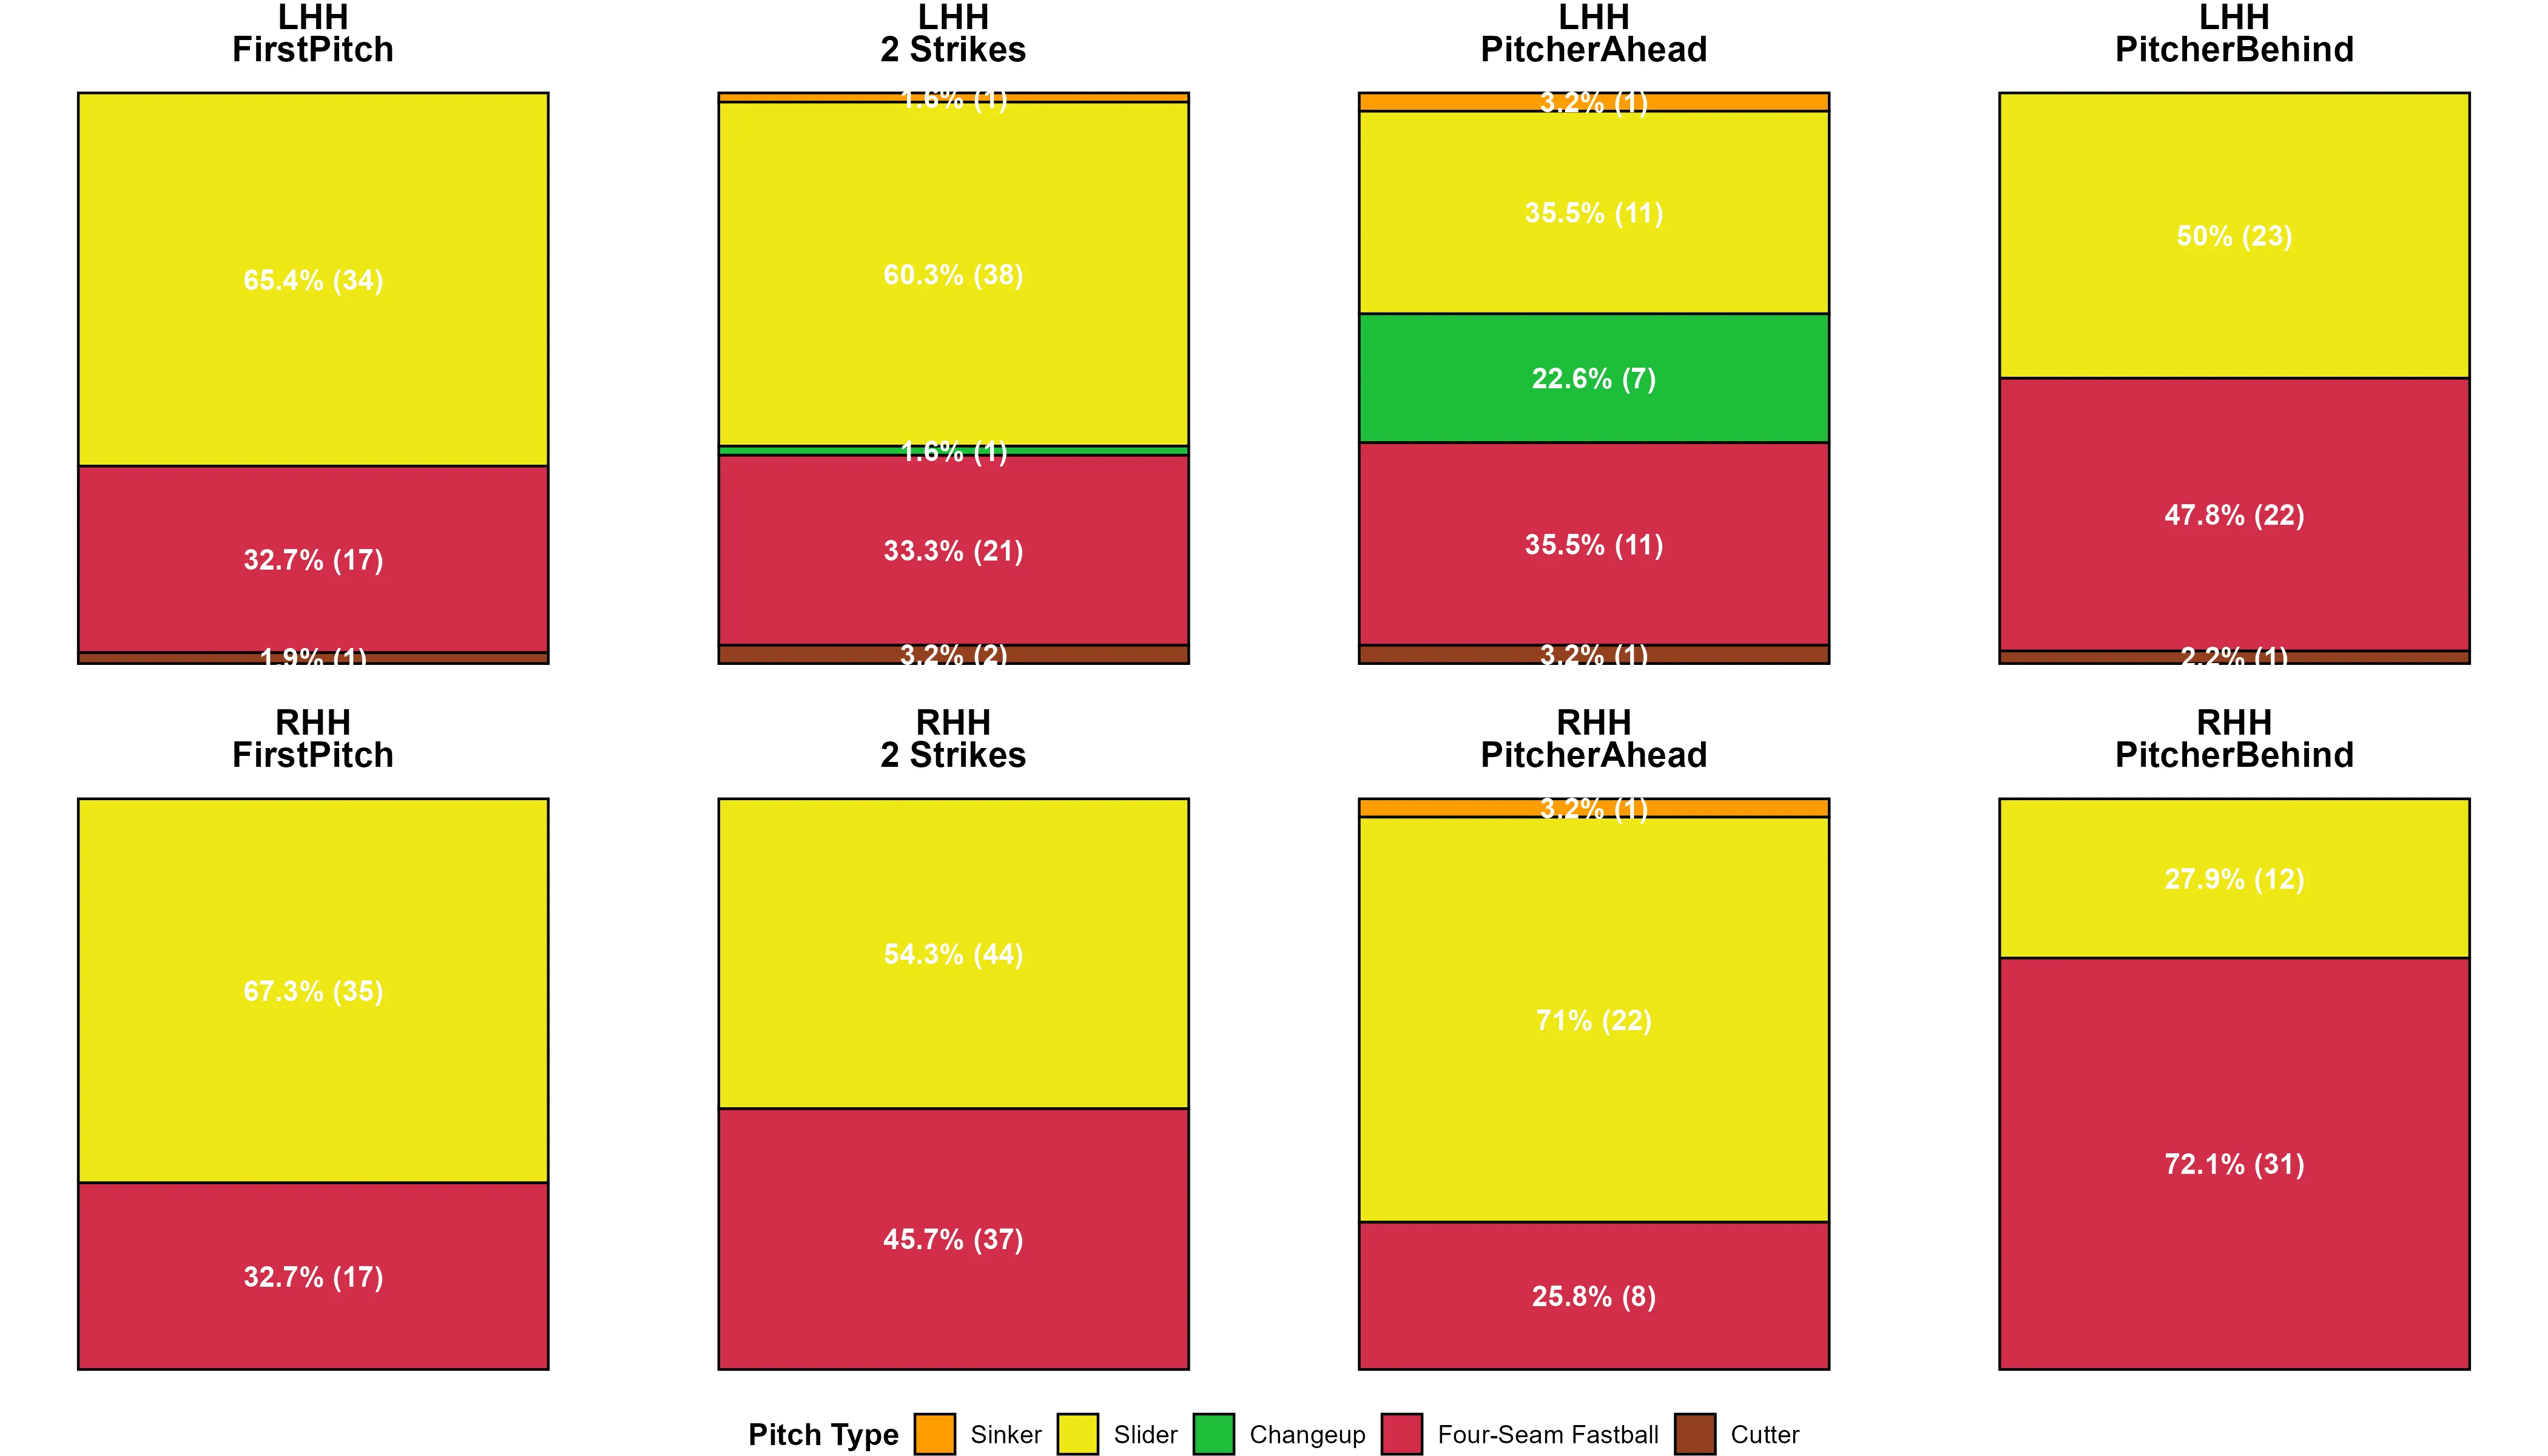
Next to that is a sequencing visualization showing how he uses his pitches by situation: first pitch, two strikes, ahead in the count, and behind.
Strike Zone View
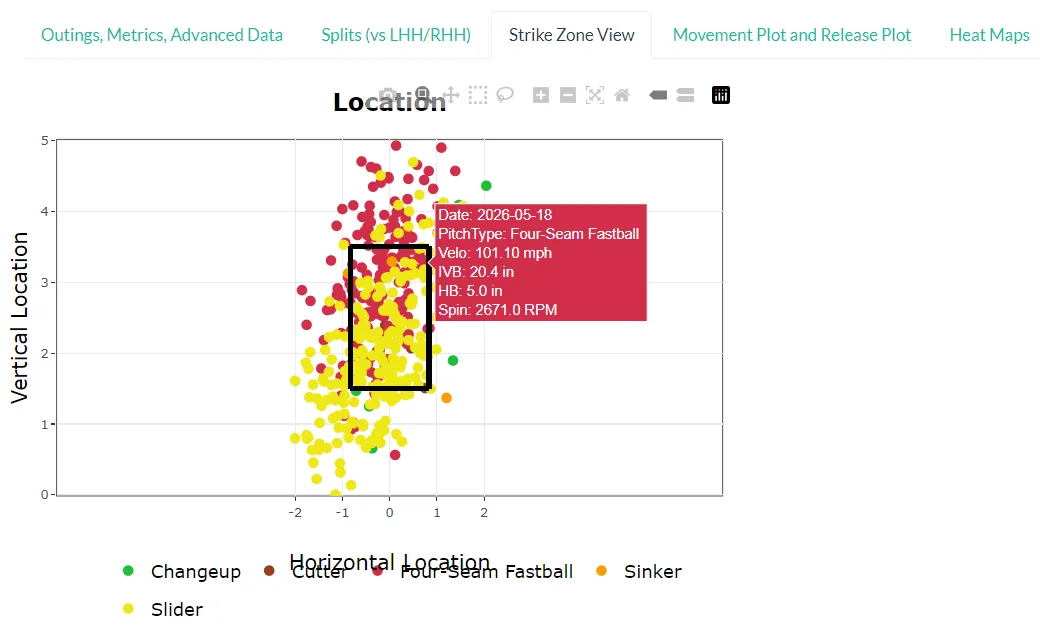
The Strike Zone tab shows the location concentrations for each pitch type. I built it with Plotly, so hovering over any point shows the date, pitch type, velo, IVB, HB, and spin. I typically use this view when looking at one or two outings rather than a full season.
Movement and Release Plots
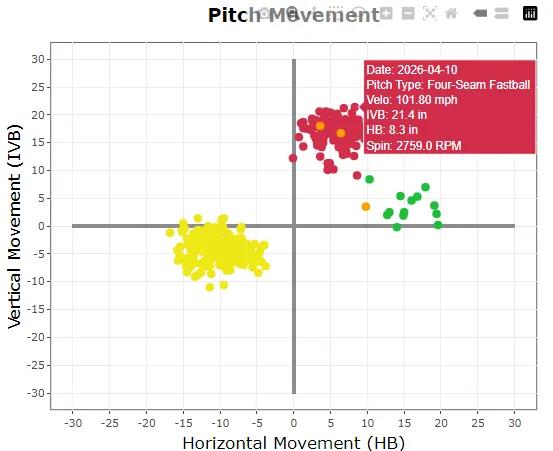
The Movement Plot works the same way as the strike zone view. Plotly makes it interactive, so you can inspect the exact movement profile of any pitch rather than eyeballing a cluster.
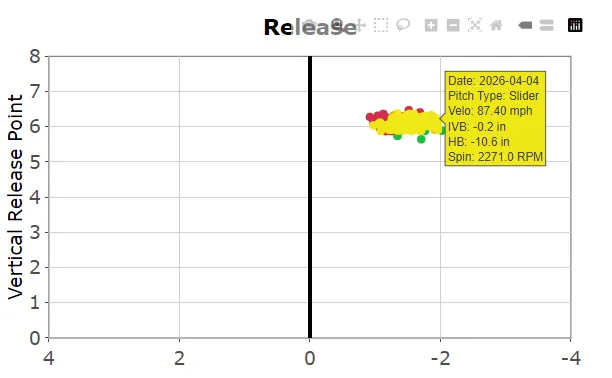
The Release Plot gives the same interactive treatment to release points, which makes it easy to check consistency across pitch types or spot a slot change between outings.
Heat Maps
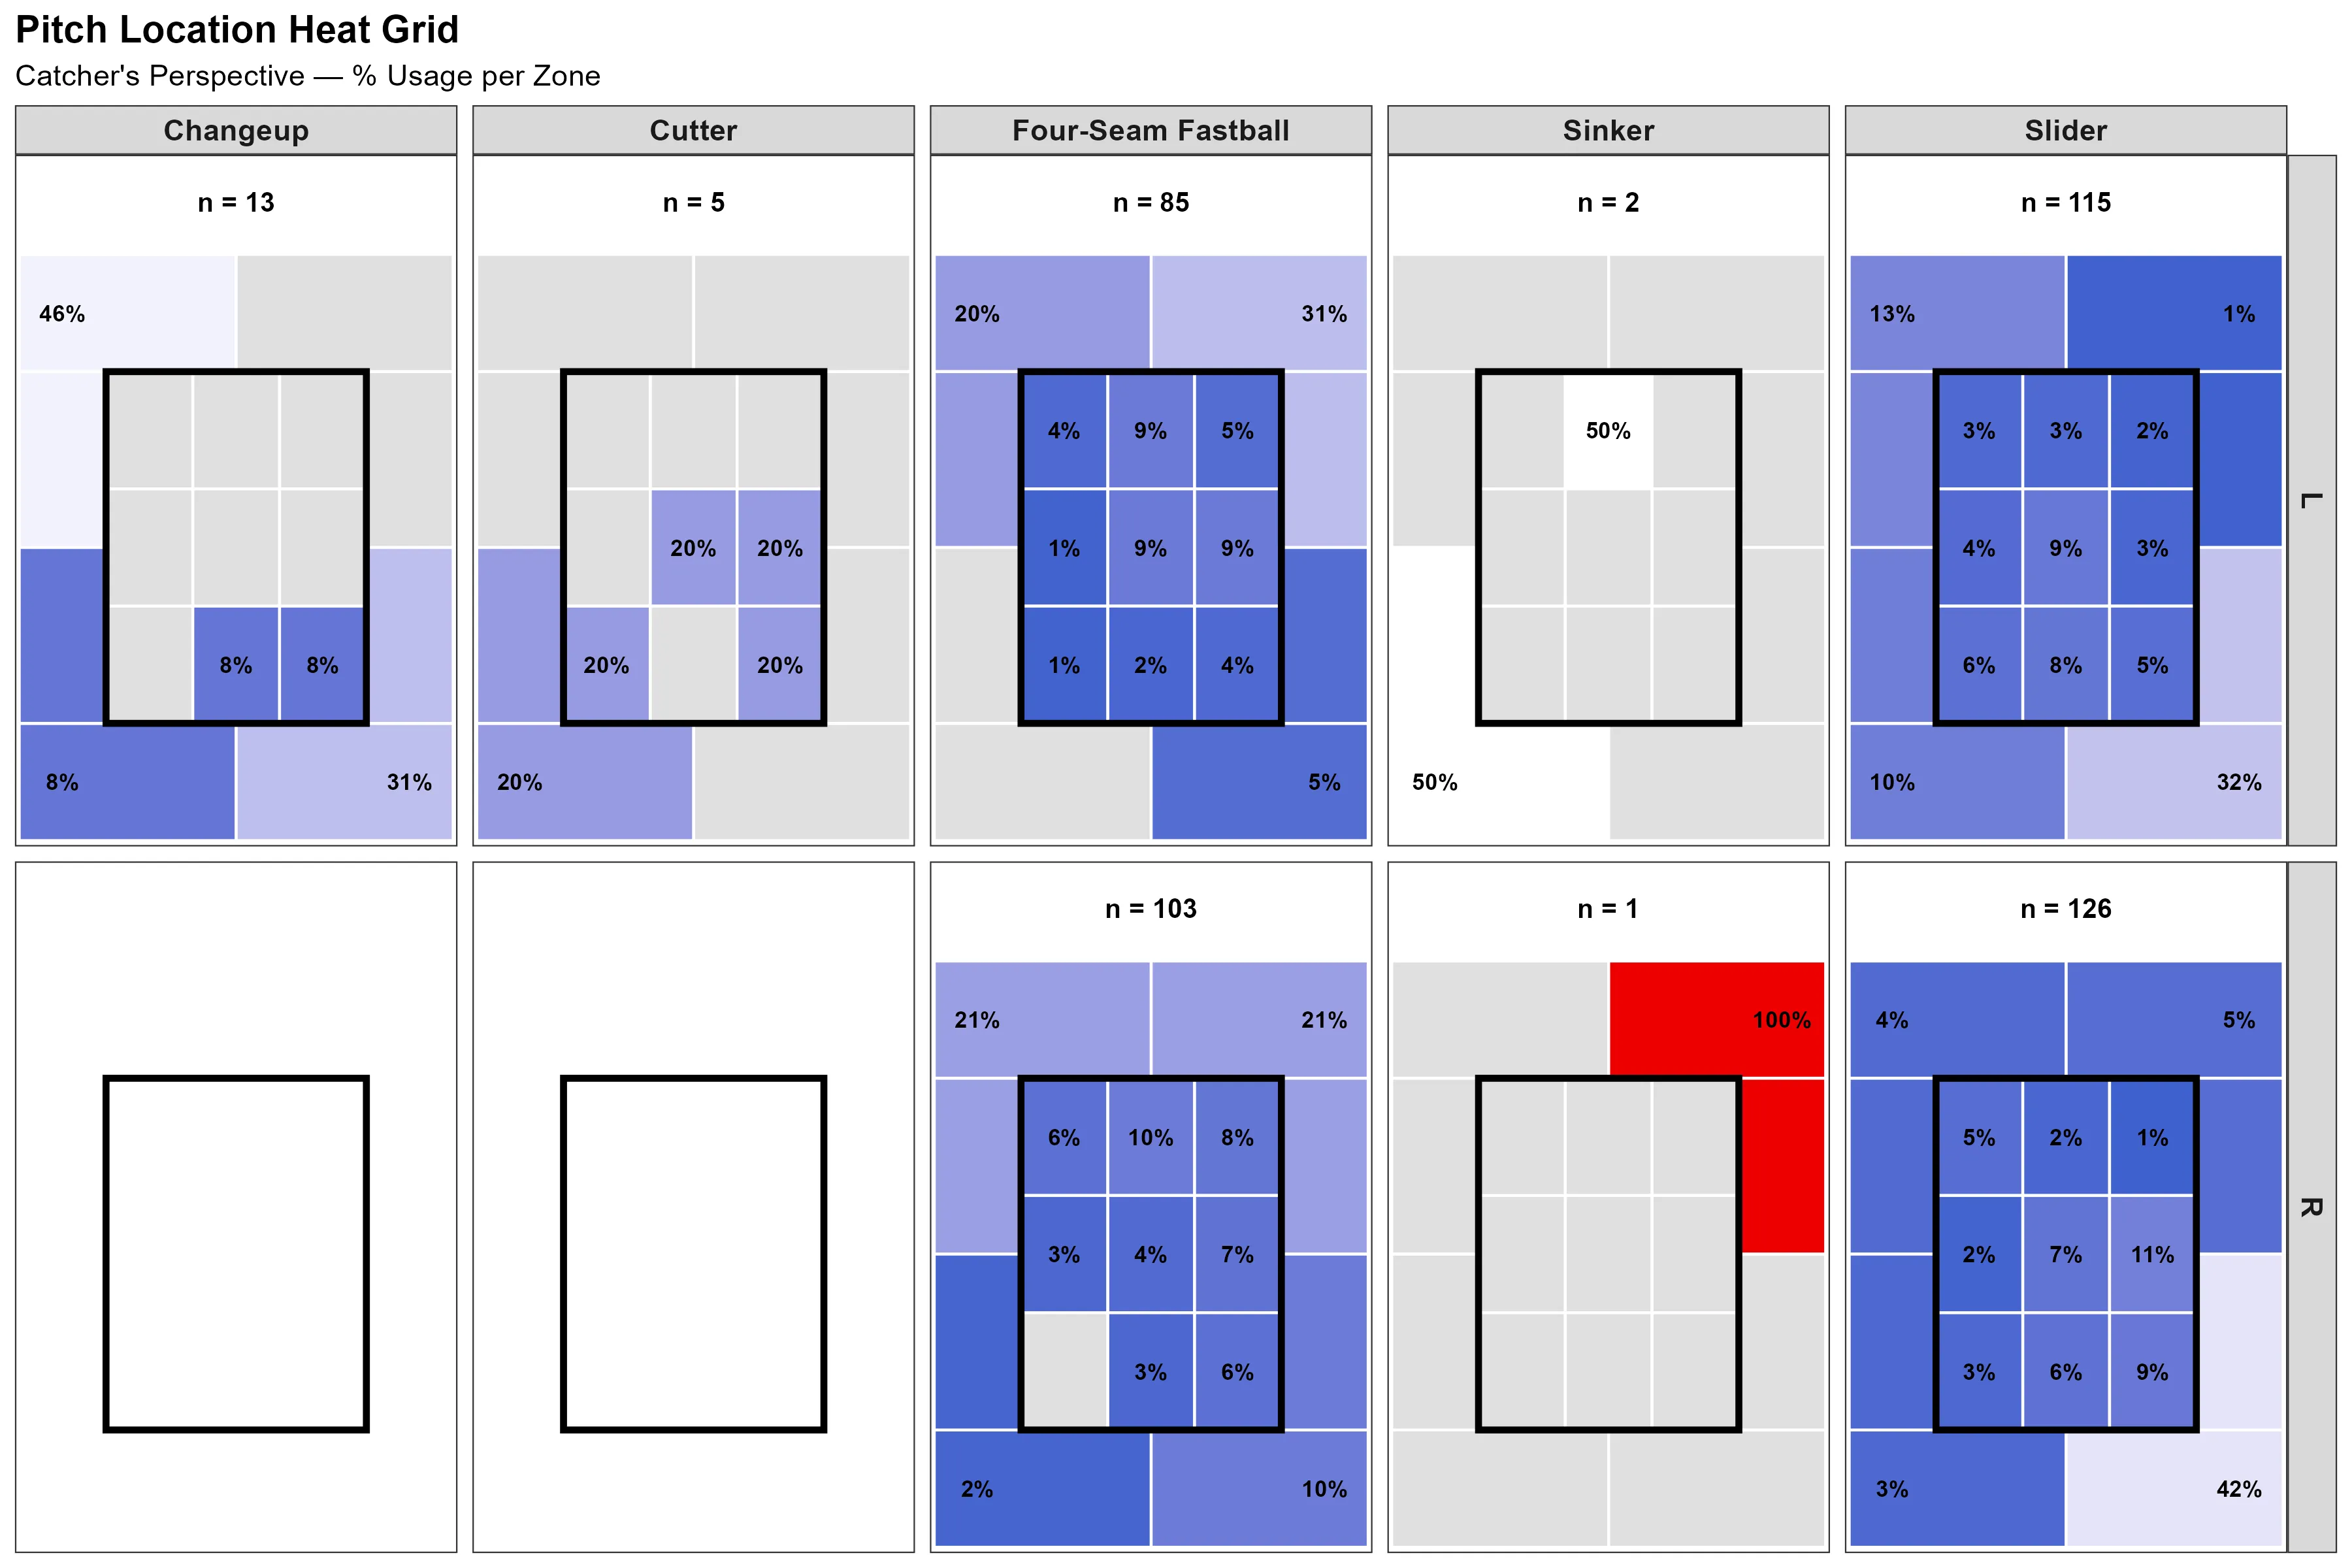
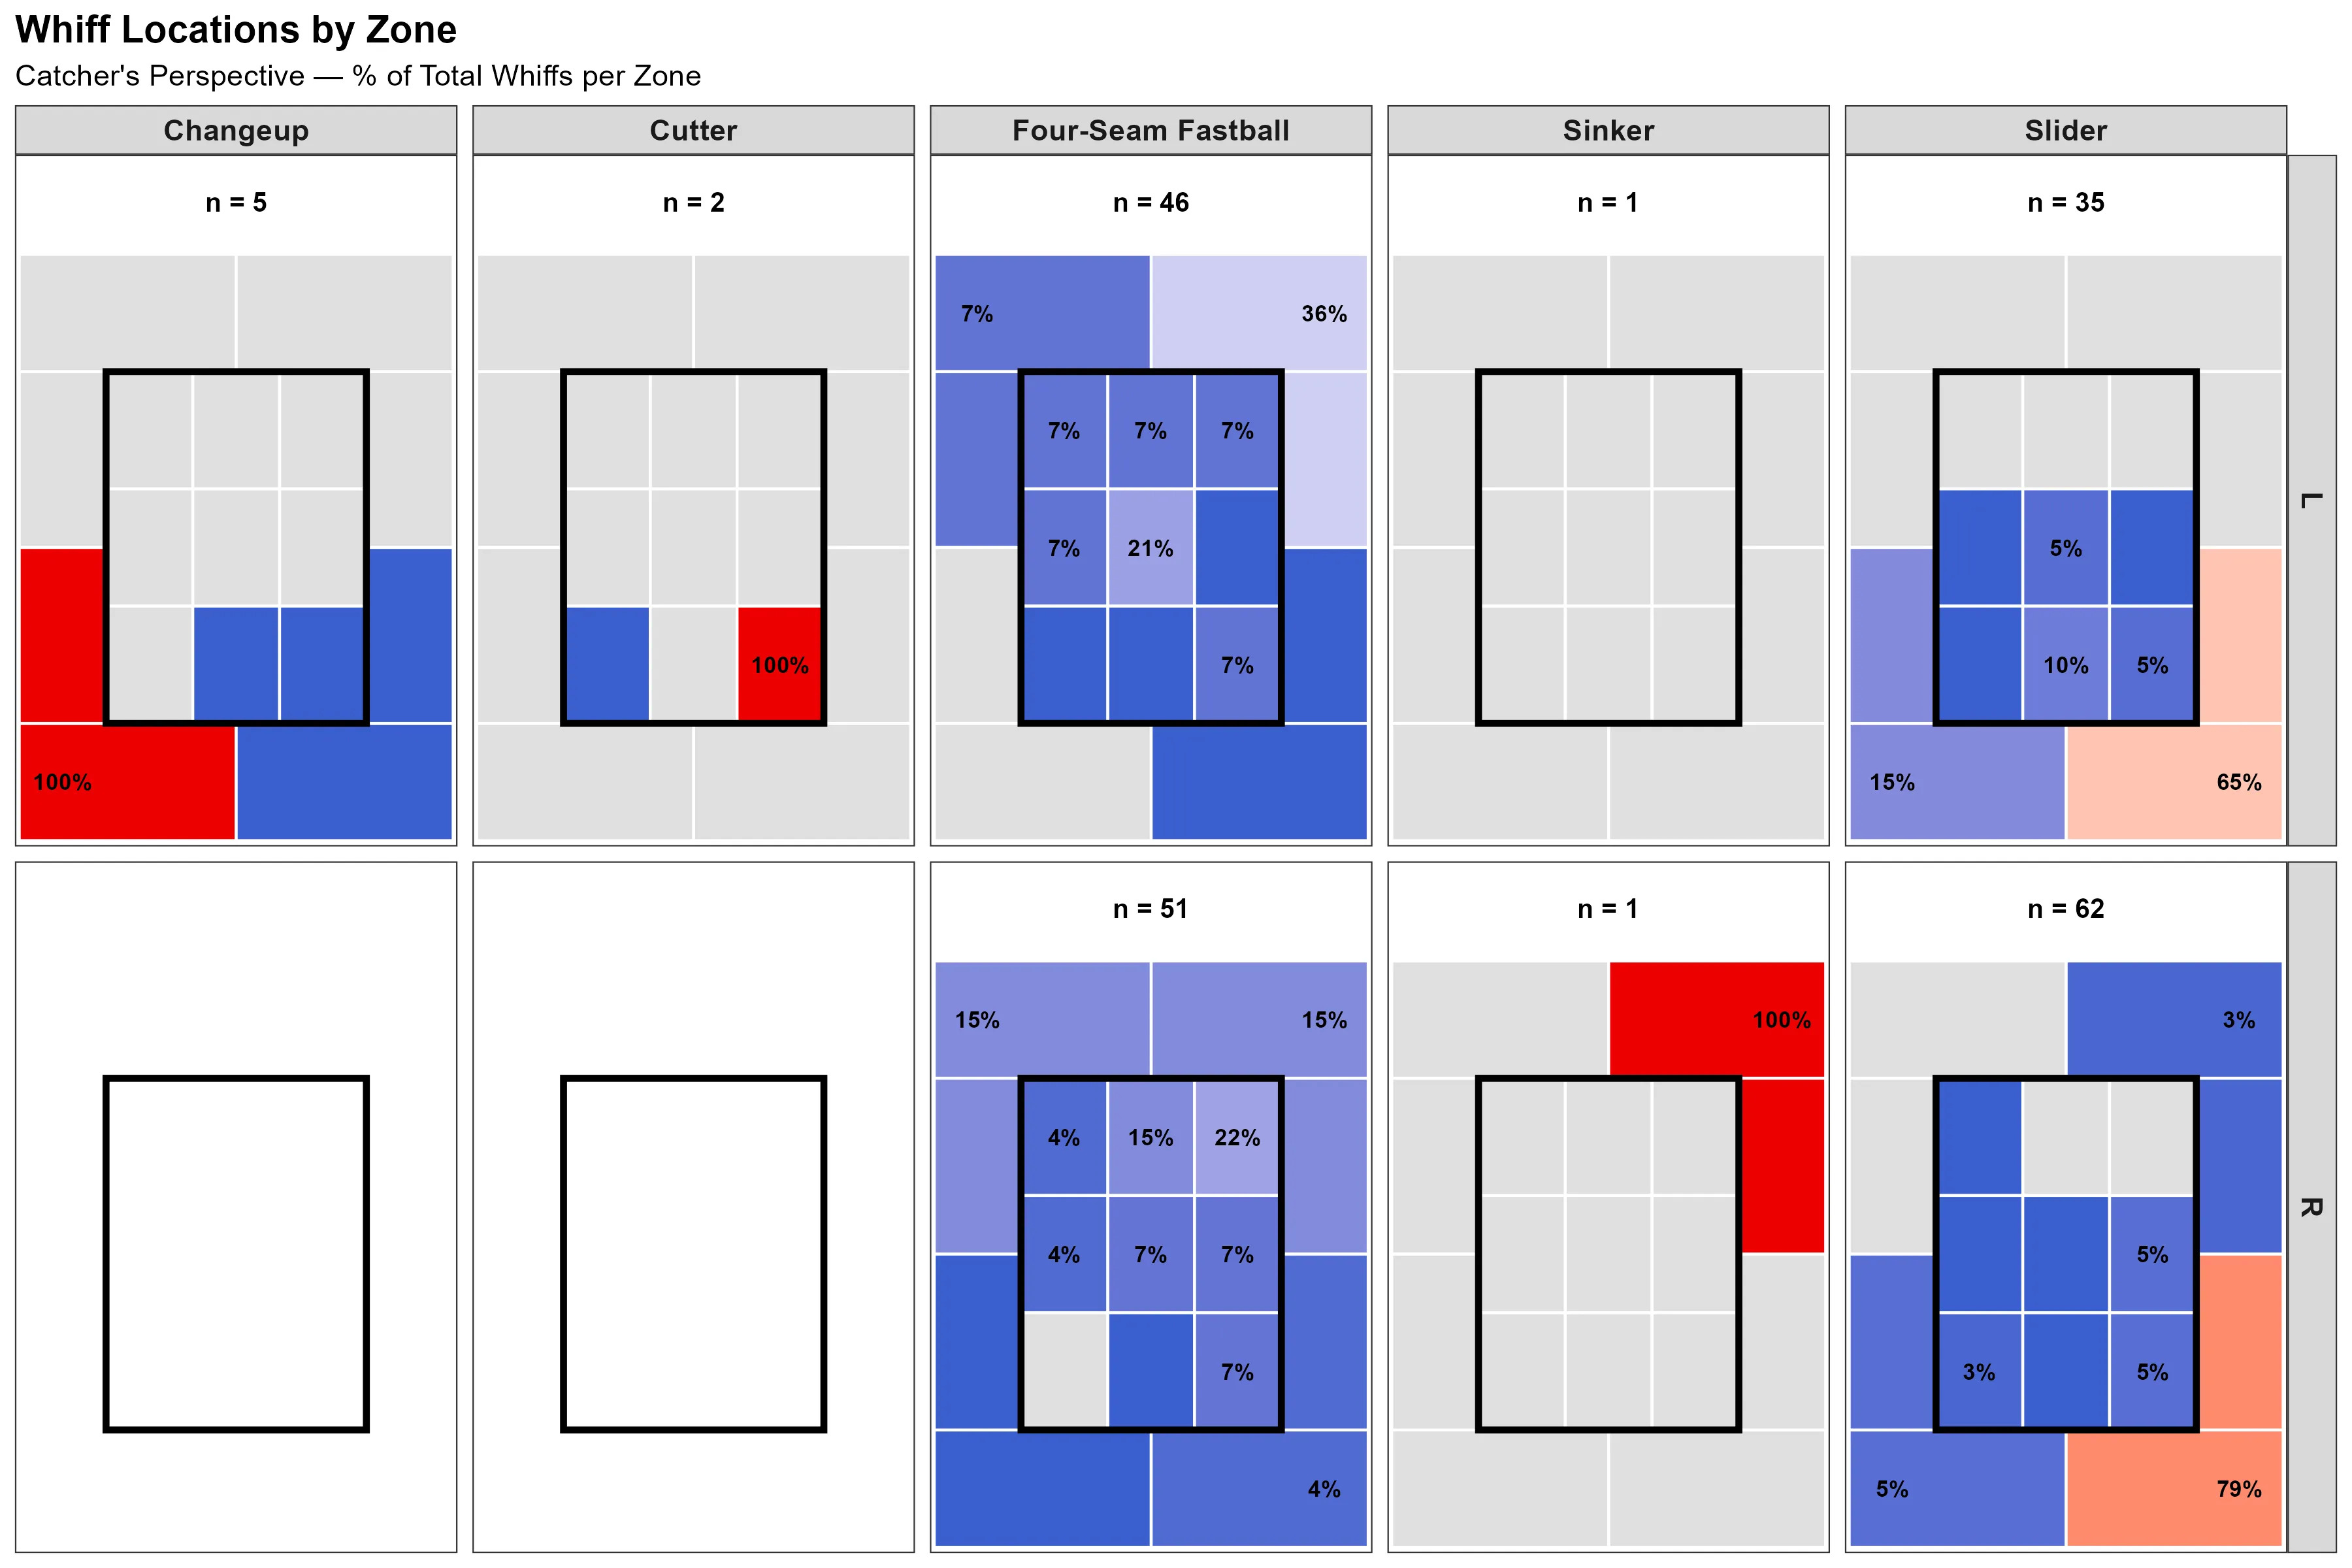
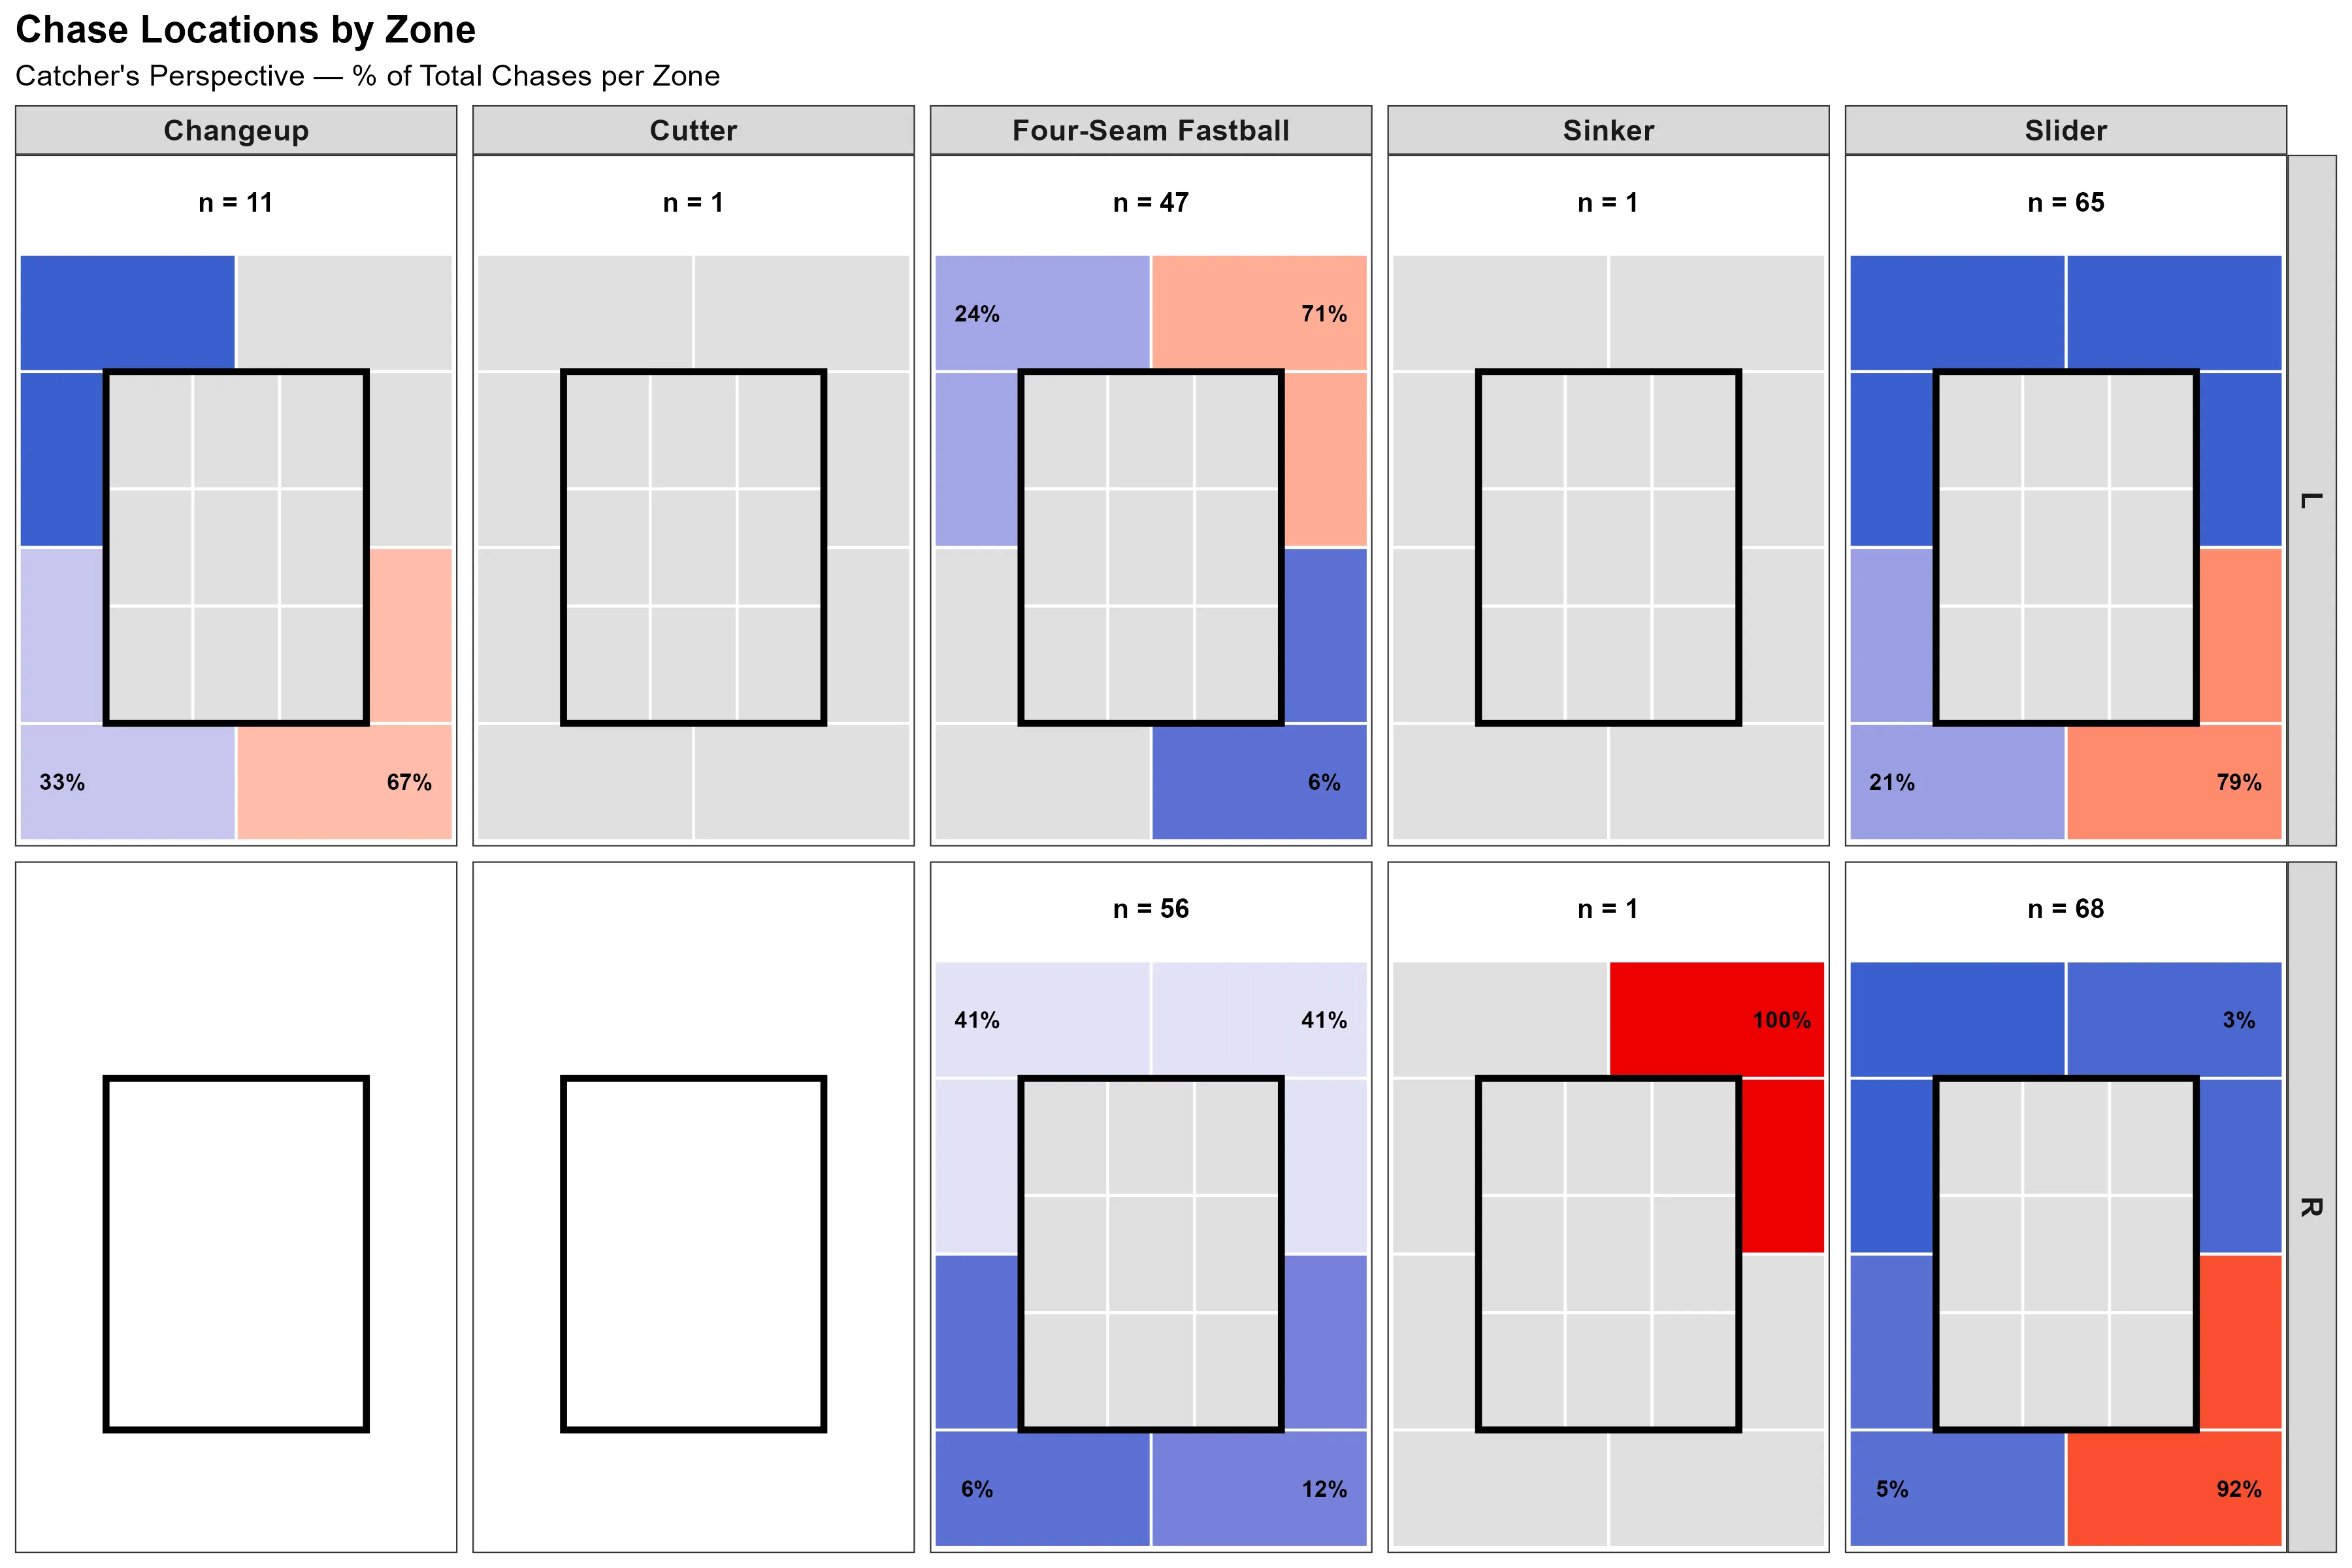
The Heat Maps tab rounds out the location picture with three grids per pitch type: overall locations, whiffs, and chases. Together they show where a pitcher lives, where he misses bats, and where he pulls hitters out of the zone.
Under the Hood
The app is built in R with Shiny, with data pulled through baseballr (FanGraphs and Statcast), team and player visuals from mlbplotR, interactive plots in Plotly, and the Stockyard Baseball integration for pitch grades. It started as a tool for my own pitcher evaluation work and grew into a full outing report platform I use any time I want to understand what a pitcher actually did on the mound.