Baseball Operations, Research & Development Independent Project 2026
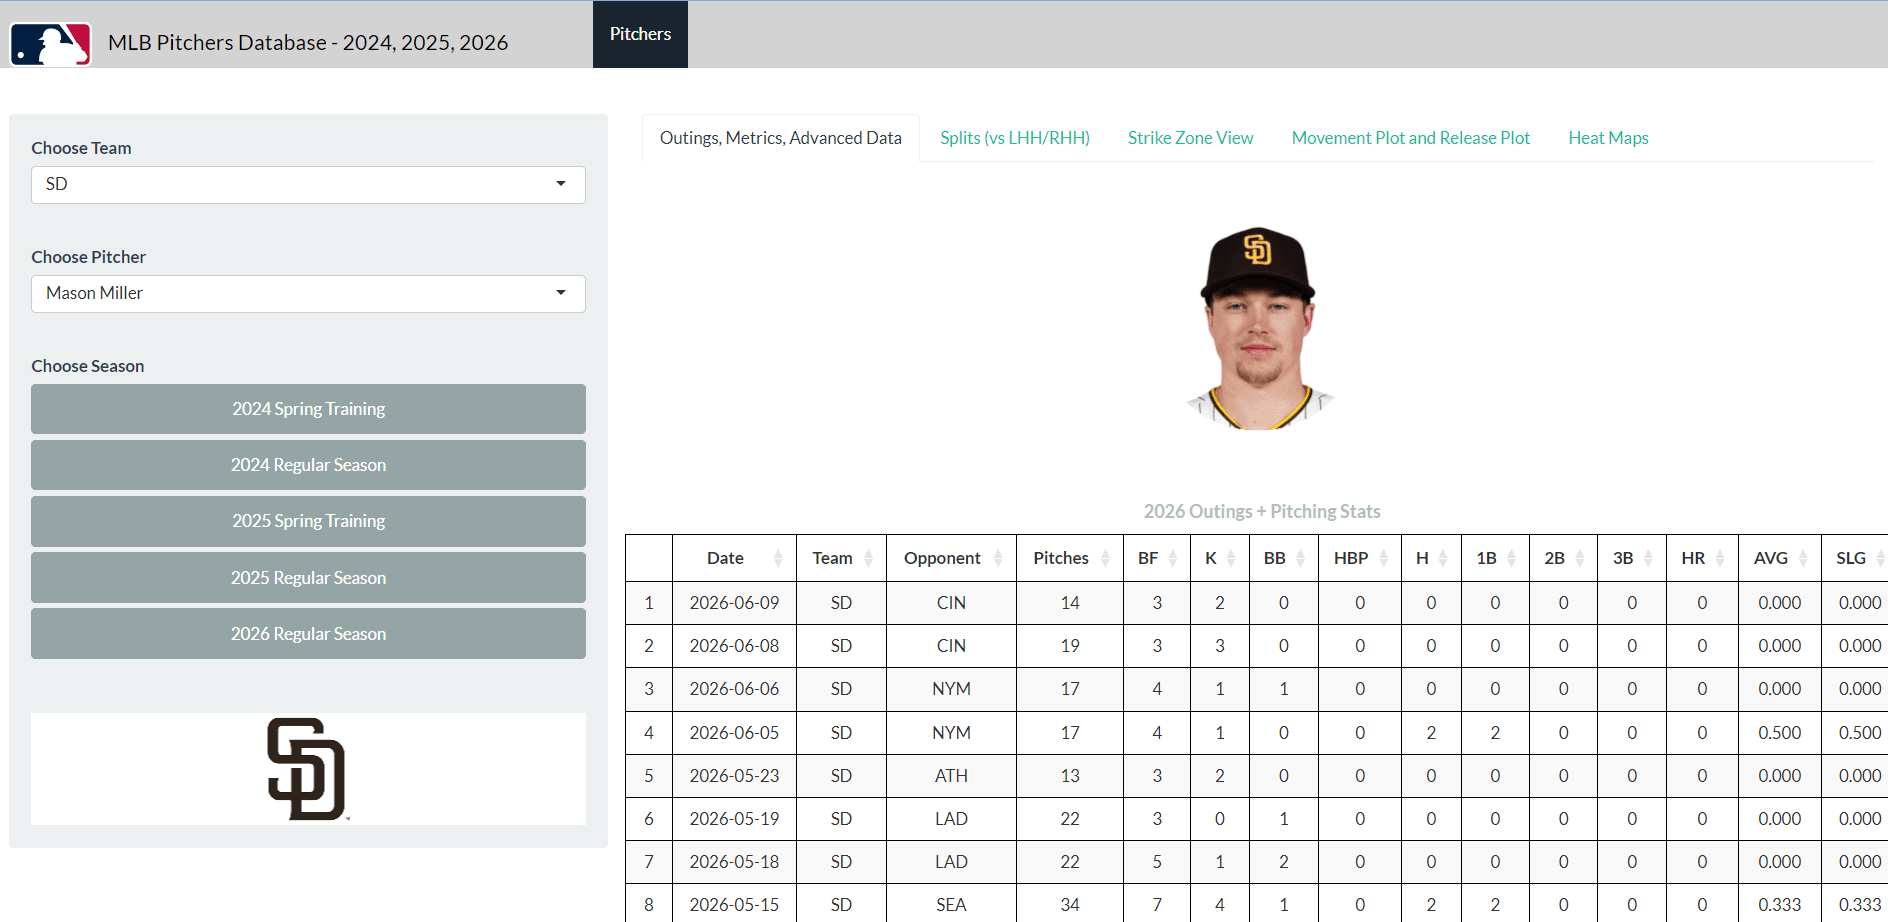
What did this pitcher actually do, outing by outing?
FanGraphs and Statcast tables, Stockyard pitch grades, splits, sequencing, movement plots, and heat maps.
Read the Case Study →
Player Development Miami Marlins, Dominican Summer League 2025
The hitting department could see development happening. Did the year-over-year numbers back up what the coaches were seeing on the field?
#1 of 25 organizations in hard-hit gain. 14 of 14 hitters improved in at least one pillar.
Read the Case Study →
Marlins DSL Returning Hitters: Org Improvement Rank, 2024 to 2025
Among 25 qualifying MLB organizations: number 1 in 95-plus exit velocity rate, number 2 in
chase rate, number 4 in in-zone contact, number 13 in strikeout rate (down 3.2), and number 14
in walk rate (down 0.2).
Marlins DSL Returning Hitters: Org Improvement Rank, 2024 → 2025
Vs. 25 qualifying MLB organizations · 252 returning DSL hitters
95+ EV% Chase% IZContact% K% BB% #1 #2 #4 #13 (−3.2) #14 (−0.2) Marlins DSL Returning Hitters: Org Improvement Rank, 2024 to 2025
Among 25 qualifying MLB organizations: number 1 in 95-plus exit velocity rate, number 2 in
chase rate, number 4 in in-zone contact, number 13 in strikeout rate (down 3.2), and number 14
in walk rate (down 0.2).
Marlins DSL Returning Hitters: Org Improvement Rank, 2024 → 2025 Vs. 25 qualifying MLB organizations 252 returning DSL hitters 95+ EV% Chase% IZContact% K% BB% #1 #2 #4 #13 (−3.2) #14 (−0.2)
Player Development Miami Marlins, Dominican Summer League 2025
How do you grade a development goal fairly when some goals are much harder than others?
Average goal difficulty 6.9 / 10. Graded A to F across three dimensions.
Read the Case Study →
Objective Difficulty vs. Outcome Grade
Illustrative scatter of individualized development goals for returning DSL hitters,
plotting goal difficulty from 1 to 10 against an outcome grade from A to F. The top-right
quadrant marks exceptional results on hard goals; the bottom-left marks weak results on
easy goals.
Objective Difficulty vs. Outcome Grade
Individualized development goals · returning DSL hitters · 2024 → 2025
Exceptional: hard goal, strong result Below target: easy goal, weak result A B C D F
Outcome grade
1 Difficulty (1 to 10) 10 Objective Difficulty vs. Outcome Grade
Illustrative scatter of individualized development goals for returning DSL hitters,
plotting goal difficulty from 1 to 10 against an outcome grade from A to F.
Objective Difficulty vs. Outcome Grade Individualized development goals Returning DSL hitters · 2024 → 2025 Exceptional: hard goal, strong result Below target: easy goal, weak result A B C D F 1 Difficulty (1 to 10) 10